Monday, 6 September 2010

Riparian Environments:River processes

There are 3 main types of river process:

Erosion
Transportation
Depositing

Erosion
The wearing away of rock on the river bed and banks. There are 4 main types: (see BBC bite size

Hydraulic action – the force of the river against the banks can cause air to be trapped in cracks and crevices. The pressure weakens the banks and gradually wears it away.
Abrasion - rocks carried along by the river wear down the river bed and banks.
Attrition - rocks being carried by the river smash together and break into smaller, smoother and rounder particles.
Solution - soluble particles are dissolved into the river.

Transportation
This is the movement of elements by a river. The diagram shows the different methods. the amount of material being carried is really dependent on the energy of the river. The slower it runs the less it transports, such as on plains or near its mouth.


Deposition

As the word suggests as the river slows it deposits material generally as the volume of water reduces say in times of drought or when it slows at the mouth or in a delta. one of the most amazing deltas is the Okavango Delta in Botswana. It is produced by a seasonal flood and as the water meets the plain that only has a height 2 meter height variation it slows and deposits material.


I have obtained much of this information from the BBC Bite size web site. it is a good revision tool available to all.

Riparain Environments: Drainage basins


The functioning of a drainage basin as an open system with inputs, outputs, transfers, stores and feedback loops.
A good definition of a a drainage basin is 'The entire geographical area drained by a river and its tributaries; an area characterized by all runoff being conveyed to the same outlet.'

Referring to the previous blog (Riparian environments:general) the Amazon has the largest drainage basin the the world.

How does water enter the drainage basin and can this be measured?
Most of the water in a basin emanates from precipitation but some comes from ground water. the diagram above shows the way in which the water enters the drainage basin. (Of course this is all part of the wider hydrological cycle).

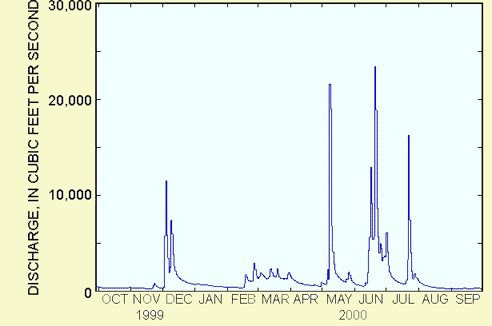
Studying the history of the amount of water allows people to consider such things as water usage for rural and urban environments,the possibility of drought or flooding. The data often collected by a stream gauge is presented in the form of a hydrograph.

A hydrograph shows changes in water levels over a specific period of time.


There are spatial and temporal (short-term and long-term) variations in hydrographs. So for example you would expect a river passing through the Alps of Europe during spring to have a large volume of water due to snow melt. The graph would then peak when the flow of water is at its greatest.

An examination of hydrographs in forecasting allows people to attempt to predict the magnitude, spatial extent and timing of floods and of course droughts.

In terms of teaching, a stream study could be undertaken over a period of a few months via a stream gauge and the results plotted on a hydrograph. The web (teaching sites and GA site) and various OU books have been used to prepare this blog. There is a wealth of information on how to carry out a study.

Riparian Environments: general


Riparian is the correct name for one of the 15 bimoes on earth. A biome is a large community of plants and animals that occupies a distinct region in the case rivers. The area where the river meets the land is called the riparian zone. Of course rivers/steams exist all over the earth passing through massivily different environments, take the huge Amazon river in South America and a small stream: diverse to say the least!

Weather: Atmospheric Lapse rates

This might be deemed a bit of a 'dry' subject but it is important in weather prediction. As a hypothetical parcel of air cools at it rises in the atmosphere and warms as it descends in the atmosphere. This cooling and warming of the air is known as the lapse rate.

If you're having trouble thinking about a parcel of air rising, think of a invisible balloon of air rising. As it rises, it cools as it expands. If it begins to descend it will compress and the temperature will increase.


A parcel of dry air, that is with no moisture in it cools at a rate of 1 degree cels. per 100m it rises, the reverse applies if it drops in height. But the importance for weather is that as it rises it reaches what is known as a 'dew point' and that is when clouds are formed as the dry air can no longer its water vapour and it condenses.


There is also a measurement for air that is saturated with water has reached the dew point temperature and is carrying as much moisture as that parcel of air is capable of holding at that temperature. This cools at 0.5 degrees cels per 100m, but can vary with temperature. This measurement is known as the Saturated Adiabatic Lapse Rate.

The differences in rates are used to determine if the parcel of rising air will rise high enough for its water to condense to form clouds, and, having formed clouds, whether the air will continue to rise and form bigger shower clouds, and whether these clouds will get even bigger and form cumulonimbus clouds (thunder clouds).

Teaching this subject could be interlinked with past and current weather events such as the floods in Pakistan. It would be interesting for the students to try and find out the ALR's before the rains producing the floods or before a hurricane (see previous blog).

WEATHER AND CLIMATE: AIR MASSES

WEATHER AND CLIMATE: AIR MASSES


Perhaps the best way of starting to look at this is to take the global perspective and then try and apply it to an area of the world that we know best, the United Kingdom.

Air masses around the earth extend for many hundreds of miles/kilometres and up into the atmosphere. They move creating different climatic conditions depending on where you are on the earth. For example we in the UK do not have the same weather as central African countries. Air masses are large bodies of air that are the same temperature and humidity. The type of weather that is produced depends on the land and sea mass that they travel over. The air masses are given names often depending on where they originate and are an indication of the type of weather that they may bring. E.g. a Tropical air mass tends to bring hot humid weather.

Air masses that travel over the sea tend to be moist than those that have travelled over land. The same applies to air masses originating over cold or hot area’s i.e. cold or hotter air.

The diagram below shows the typical air masses that affect the UK. (NOT ATTACHED SEE DIAGRAM ON 'PAGE' OF THE SAME TITLE).
When air masses come together they create a ‘front’, creating clouds and changing the weather. The diagram shows that in the UK we have air coming from all directions with different qualities giving us a great verity of weather types. Good and bad! The air mass is not the only indicator of weather, there are other factors such as speed, land mass etc. and those elements are perhaps for another day.

There are other types of air masses over the globe but for this blog we have considered that air masses are global large blocks of air that when they collide create weather systems. There are mainly 4 affecting the UK. In future blogs I will look at other climate features, to tempt those taste buds: hurricanes and mid latitude depressions to name but 2.


For this blog I have used various search engines and I have found the information on the BBC site really helpful but many others as well. I am finding that I need to develop skills on down loading information. I do not know how to insert a picture in the correct location of the text. Any help would be gratefully received.

Monday, 23 August 2010

Hurricanes

This is a satellite picture of Hurricane Katrina that hit the USA in August 2005, affecting in particular New Orleans. This is a great case study of both physical and human geography and how they can be interlinked in study.


I am going to focus on the physical aspects as one of the points of this sequence of blogs is to develop my knowledge of my' weaker' subject which generally relate to physical elements.


  • Typhoon, cyclone or hurricane?

Really it just depends where they occur in the world. The map shows where they can originate and the appropriate name.

How do they develop?

They all start from a basic thunderstorm over the ocean. A source of moist warm air derived from tropical oceans, the temperature generally has to be over 27 centigrade. The winds blowing in different directions converge and cause the air to rise and from storm clouds. The winds are known as low wind sheer and this allows the storm clouds to rise vertically to a high level. The clouds then start to spin having been induced by the earths rotation.

The storm becomes allocated a typhoon or a hurricane if the speeds of the winds exceed 74mph and then they are given a name such as Katrina. In additional they are also given gradings depending on the speeds of the wind, so Katrina for example was a category 5 hurricane with speeds of over 155mph. This the top category.

The damage that is caused by these massive storms can be utterly devastating. Katrina hit land fall at New Orleans and caused massive flooding and devastation of much of the lower lying land occupied by the poorer residents mainly black Afro-Americans. Support from the Bush government was perceived as slow, leading to accusations of a lack of care by the administration for the poorer, black community.

The physical development of typhoons or hurricanes occurs over oceans in the tropical belt, they gather speed and power whilst moving across the sea and dramatically lose power when they hit land. Then the physical geography interacts with the human world. The physical development and the impact on the human geography will make a good case study.

Resources for this could include, weather activities, watching videos of the development and its' consequences. I have found various web sites with fantastic resources including the Met Office, The Geographical Association, Enchanting Teaching to name just 3. These can be differentiated depending on ability of the student.


Mid-latitude depressions


A depression is an area of low pressure accompanied by a front. They commonly affect the weather in the UK.


There is a great experiment to help us to understand the differences in air pressure, that can easily be set up in a class room:

  • Blow up a balloon to just beyond the width of a large jar, and tie the end to keep the air in

  • Place pieces of paper in the jar and set them alight, therefore heating the air.

  • Blow out the flames and place the balloon on the top of the jar.

    Outcome: The balloon will be sucked into the jar. this is called precipitation, generating low pressure and therefore sucking the balloon into the jar, due to a difference in air pressure. This is just an experiment in a class room, which is dramatic can you imagine what it is like when 2 massive air masses, come together creating a mid-latitude depression!
The Bergen School Model was devised to assist in the understanding of the formation of Mid-latitude depressions. It comes in 4 stages:


  • Origin and infancy: warm air front meets cold air front, generally warm coming from the south of the UK and cold from the north.

  • Maturity: the warm air spirals over the cold anticlockwise as the cold air sinks. Then a warm area exists between the cold and warm fronts.
  • Occlusion: the warm sector disappears as the cold front moves faster. Cold air is denser, so it forces the warm air upwards. It is harder for the warm lighter air to move and this causes the cold air to sink. The cold air moves at about 40/50 mph whereas the warm travel travels at about 20/30 mph.

  • Death: the frontal system dies as the warm air is forced upwards and cools and the cold air remains underneath. the difference in temperatures have level out and therefore there is no longer an occluded front.

The result of this is a cold period and depending on the energy in the front, it can cause a wide variety of precipitation. in the UK an example of this occurred in 2002 when a storm hit. according to the BBC reporting at the time, 7 people died and repairs to property were expected to total over £50 million according to the insurance industry. Wind speeds reached 90mph and rainfall caused wide spread flooding. This was due to the existence of a mid-latitude depression or a low. The storm was wide spread hitting many parts of the UK from Aberdeen to London.
This would be a great case study as the storm will probably be in the living memory of the children's parents and other family members. Research can be undertaken to not only look at the physical geography but also the human element by looking at the effects of the storm on individuals and communities.